
当サイトでは実際に購入した商品のみをレビューし、アフェリエイトリンク付きでご紹介しています
【Python】Plotly.Expressでインタラクティブな折れ線グラフを作る


Search Consoleのデータを、インタラクティブなグラフにして、WordPressへ表示する方法をご紹介します。
Plotly.Expressを使って、とてもカンタンに実現できます。プログラミング初心者にもオススメです!
この記事でわかること
- インタラクティブなグラフとは?
- Plotlyとは?
- Plotly.Expressの使い方
- Search Consoleの結果をグラフにする方法
- Plotlyで作成したグラフを、WordPressのサイトに載せる方法
目次
インタラクティブなグラフとは?
このグラフは、2021年4月のこのサイトのサーチコンソールの結果データです。
操作によって、グラフの表示を変更できます!
たとえば…
- 折れ線グラフにカーソルを合わせると、数値が表示される
- variableをクリックすると、表示するグラフを選択できる
今回は「PythonのPlotly.Expressで、HTMLを生成する」という方法で実現しました。

WordPressのプラグインじゃ、ダメなの?
もちろん、プラグインでもOKです。
「プラグインを増やしたくない」「Pythonの開発環境がある」というときに、Plotly.Expressはオススメです。
Plotlyとは?
「Plotly」とは、データ可視化のプラットフォームです。インタラクティブなグラフを作ることができます。
Plotlyというカナダの企業が開発しており、Python・R・JavaScriptなど、いろいろな環境からAPIを実行することができます。
「Plotly.Express」とは、便利なPlotlyを、更にカンタンに使うことができるPythonのライブラリです。

Plotly.Expressの使い方
サーチコンソールのデータをCSVに保存する
- Google Search Consoleにログイン
- 「検索パフォーマンス」をクリック
- 表示日付を選択する
- 「エクスポート」ボタンをクリック
- 「CSVをダウンロード」をクリック
- お使いのパソコンの任意の場所にCSVデータを保存する
【初回のみ】追加ライブラリをインストールする
ここからは、Python開発環境「Anaconda」のインストールが必要です。
- ターミナルを起動する
- pip install pandas を入力し、実行
- pip install plotly を入力し、実行
pip install plotly
Collecting plotly
  Downloading plotly-4.14.3-py2.py3-none-any.whl (13.2 MB)
     |████████████████████████████████| 13.2 MB 10.2 MB/s
Requirement already satisfied: six in ./opt/anaconda3/lib/python3.8/site-packages (from plotly) (1.15.0)
Collecting retrying>=1.3.3
  Downloading retrying-1.3.3.tar.gz (10 kB)
Building wheels for collected packages: retrying
  Building wheel for retrying (setup.py) ... done
plotlyのインストールに成功すると、ターミナルにこのような表示がされます。
Jupiter Notebookを起動し、コードを貼り付ける
- Anaconda-Navigaterをクリック
- Jupiter Notebookをクリック
- 入力欄に以下のコードを貼り付ける
- 3行目にCSVのフルパスを入力
- 「実行」をクリック
import pandas as pd
import plotly.express as px
df = pd.read_csv('★ここは保存したCSVのフルパスに書き換えてください★')
fig = px.line(data_frame=df,x='日付',y=['クリック数','表示回数'],color_discrete_sequence=['blue','purple'])
fig.to_html(include_plotlyjs='cdn',full_html=False).encode().decode('unicode-escape')
たったこれだけで、動的グラフのHTMLが生成できます。
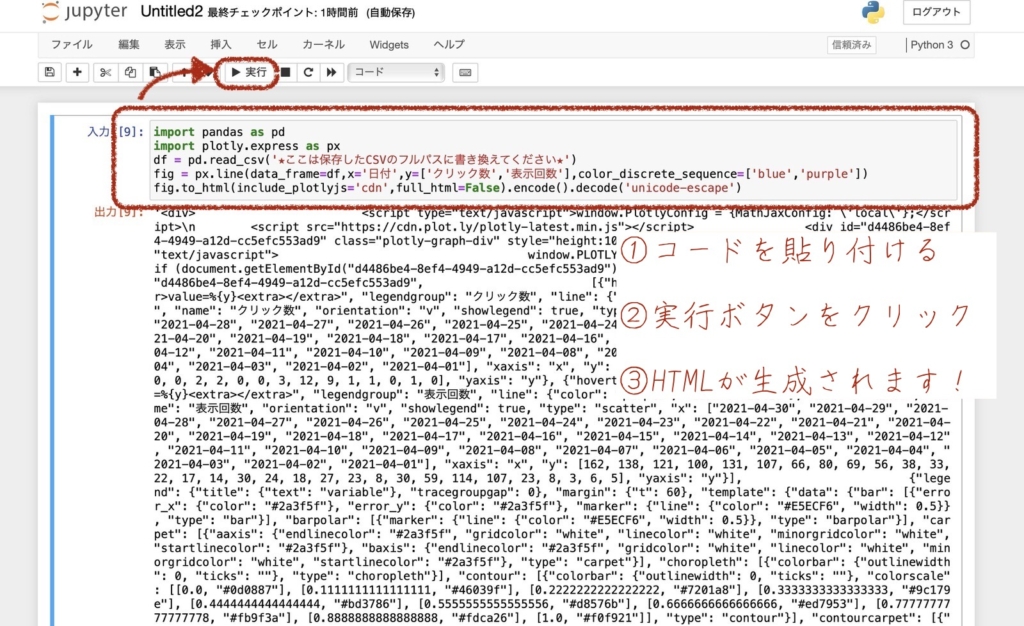
わずか5行!
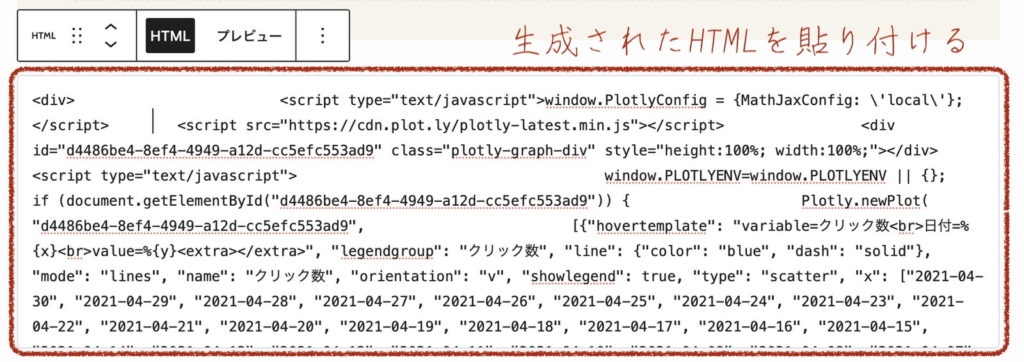
WordPressにグラフのHTMLを貼り付ける
- WordPressにログインし、編集画面を開く
- 「カスタムHTML」のブロックを追加する
- Pythonで生成したHTMLを貼り付ける
- scriptタグ付近にある「\n」を、手動で削除する
- 正常に表示できるか、プレビューをする
- 記事を保存して、完成!
カスタムHTMLに含めず、削除すべきもの
- 文頭のシングルコーテーション
- 文末のシングルコーテーション
- scriptタグ付近にある\n
できました!カンタン。
発生した課題と回避方法
- 日本語がUnicodeで表示されてしまい、読めない。
→生成したHTMLを、デコードし直した。(.encode().decode(‘unicode-escape’)の部分) - 表示回数とクリック回数が大きく異なるため、クリック回数が底辺を這うようなグラフになってしまう
→2軸表示にしたい。
2軸のグラフの作り方は、こちらの記事にまとめました。よろしければ、ご一読ください。
あわせて読みたい


【Python】Plotlyで2軸の折れ線グラフを作る方法
Plotlyで、インタラクティブな2軸のグラフを作りたい! PythonのPlotlyライブラリを使用して、インタラクティブなグラフを作成します。 数値が離れた2つデータを使…

参考サイト
今回のスクリプトの作成にあたり、以下の記事を参考にさせていただきました。
ありがとうございます。
参考サイト
参考サイト

PythonでUnicodeエスケープされた文字列・バイト列を変換 | note.nkmk.me
Pythonにおいて、\u3042のように\uと4桁の16進数からなるUnicodeエスケープシーケンスを含む文字列(str)・バイト列(bytes)を相互に変換する方法を説明する。 Unicodeエ…
まとめ
たった5行で、これほどのグラフを作れるとは、驚きます。
他言語ならば、FileSystemクラスを呼び出して、CSVファイルをオープンするだけで、5行終わりそうです。
Plotly.Expressは、コストパフォーマンスが素晴らしいライブラリだと感じました。
今後も、Plotly.Expressについて、勉強していきます。
サイトのデータを公開する場面で、生かしていきたいです。
あわせて読みたい

【運営報告】ブログの記録(2021年4月)
2021年4月のブログの運営報告をまとめます。 この記事でわかること ブログ記事数=約10では、どのくらいのアクセスがあるのか はじめに このブログは、2021年の年末ま…
最後まで読んでいただき、ありがとうございました。
みなさまの暮らしがより良くなりますように。