
当サイトでは実際に購入した商品のみをレビューし、アフェリエイトリンク付きでご紹介しています
【運営報告】ブログの記録(2021年4月)


2021年4月のブログの運営報告をまとめます。
この記事でわかること
- ブログ記事数=約10では、どのくらいのアクセスがあるのか
目次
はじめに
このブログは、2021年の年末までに、60記事投稿を目指しています。
この記事では、2021年4月の運営結果をまとめます。
あわせて読みたい


ロードマップの作成【ブログ-2021年版】
はじめに このブログのロードマップを作成しました。 2021年4月から年末までの目標を定め、達成したら自分で自分に賞品を買う計画です。 完成品 出来上がったロー…
2021年3月12日に、Googleアナリティクスとサーチコンソールを設定しました。
2ヶ月目の記録です。
【月次報告】Googleアナリティクス
2021年4月1日〜4月30日の記事数の遷移や、アナリティクスの結果は以下の通り。
| 月初の記事数 | 6 |
| 月末の記事数 | 15 |
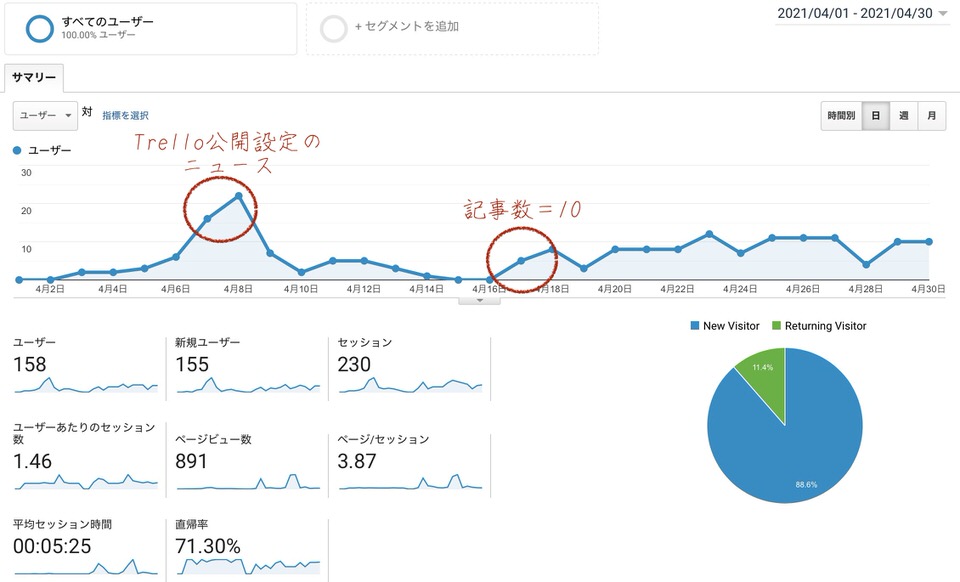
- Trelloの公開設定に関するニュースがあり、一時的にアクセスが増えた
- 記事数が10以上になって、少しずつアクセスが来るようになった
【ロードマップ・4月末の目標】を無事達成できました!
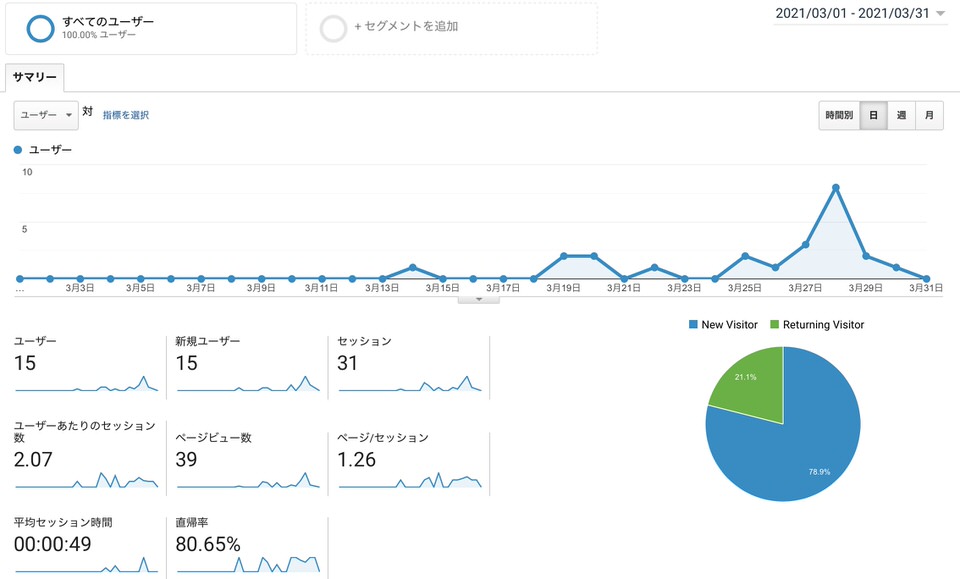
2021年3月12日〜3月31日のアナリティクスの結果は以下の通りでした。
1ヶ月前と比べれば、成長しています。
【月次報告】Googleサーチコンソール
グラフのキャプチャもいいけど…、
せっかくなら動的なグラフを表示したい!
プラグインやJavaScriptという選択肢もありますが、PythonのPlotly Expressのコスパが良いです。
カンタンにグラフができました。
たとえばこんな感じ。
実際のデータでグラフを作成してみました。
線上にカーソルを合わせたり、variableをクリックすると、グラフの表示が変わります。
Plotly熟練度を上げて、定期報告のフォーマットにしたいです。
あわせて読みたい

【Python】Plotly.Expressでインタラクティブな折れ線グラフを作る
Search Consoleのデータを、インタラクティブなグラフにして、WordPressへ表示する方法をご紹介します。Plotly.Expressを使って、とてもカンタンに実現できます。プログ…
まとめ
定点観測をして、毎月の変化をまとめていこうと思います。
ブログを始めたばかりの方や、これから始めようと考えている方の参考になれば幸いです。
最後まで読んでいただき、ありがとうございました。
みなさまの暮らしがより良くなりますように。